How a lakehouse-native SIEM changed the way I think about ingestion, detection, and investigation.
Engineering the Lakehouse SOC
This post dives into the core of Security Engineering and SIEM Training, detailing how a Lakehouse-native SIEM like Lakewatch from Databricks, fundamentally changes SOC workflows. We will explore the mechanics of migrating to Databricks-backed security operations, addressing how to maintain continuous threat coverage, prevent silent pipeline failures, and master detection engineering through hands-on training.
Most SIEM migrations come with a familiar dread: you find gaps in your threat coverage, while the system is already in production and is subject to attacks. You might have to rebuild operational visibility, iterate on your investigative frameworks, and redeploy detections you already created, all while threat actors keep moving. So, there's always a gap where your threat coverage dips, making it harder for SOC teams to catch up. For instance, when AWS CloudTrail logs take three days to properly map to the new SIEM's schema, the SOC team is temporarily blind to any cloud data exfiltration during that window.
From the perspective of a SOC engineer, here are the two practical examples of what can break or where a failure doesn't raise an error during a migration.
What breaks
What it costs
Timezone handling issues. The source sends timestamps with no offset, and the parser reads the naive string as UTC. Every event lands four hours off.
With off-hours defined as midnight to 6am, this four-hour shift causes several issues: False Positives: A 9am login stores as 05:00 and incorrectly trips the rule. False Negatives: A 2am login stores as 22:00 the previous day and slips past the rule. Broken Correlations: Joins to any correctly stamped source will miss by exactly four hours.
Mapping translation issues. The source sends status=denied, but the parser expects status=failure. With no branch for denied, the value falls through to the default and normalizes to Unknown.
The rule filters status_id=2 and matches nothing, while the table fills with real failed logins under Unknown.
In both scenarios, the pipeline finishes successfully. Failures are silent and go unnoticed. Instead of letting these silent failures go unnoticed in a black-box system, modern SOCs need a platform where data pipelines and detection logic is more transparent. This is where Lakewatch comes in.
What is Lakewatch?
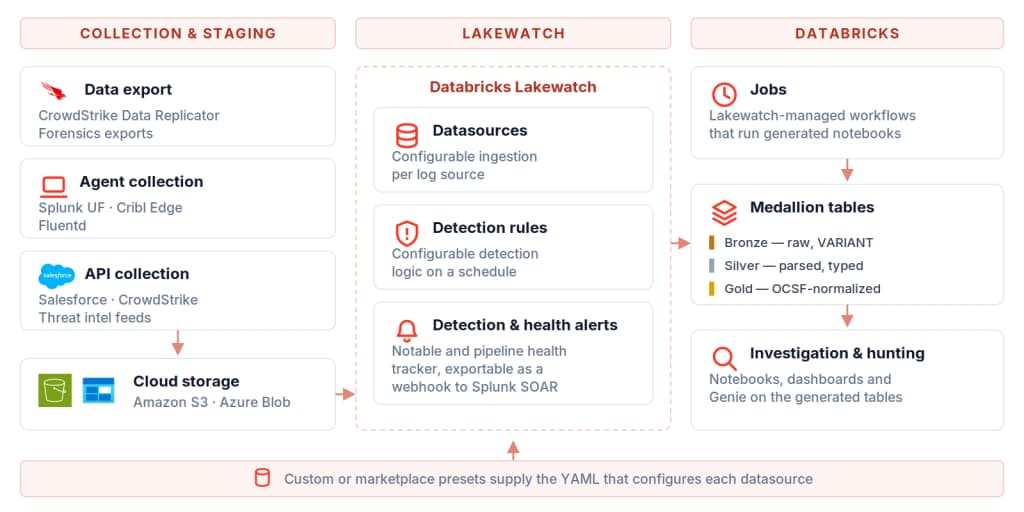
Lakewatch is an open, agentic SIEM that lives on the Databricks Lakehouse. Security data sits as Delta lake tables, and every part of the SOC workflow operates on those tables, with no separate or siloed detection stores and no export-to-investigate handoffs. With Lakewatch, the data stays transparent, logic remains accessible, and you own the remediation cycles.
Typically, with most SIEM platforms, a remediation cycle is a disjointed process: an alert fires, a SOC analyst triages the threat, exports data to investigate based on known patterns, fixes the issue, and finally attempts to tune the detection rule. In legacy systems, this often means jumping between siloed tools and relying on trial-and-error method to fine-tune a rule.
With Lakewatch, that entire workflow happens in one unified environment, and it starts with how the data is first ingested. For this, Lakewatch utilizes presets: declarative YAML configurations to automatically parse and normalize raw vendor logs as they enter the platform. Since these presets ensure your data lands cleanly into structured schemas, the detection rule that fires and the raw data you pivot into during an investigation live in the exact same governed Lakehouse.
When an alert fires, you don't need to export data or switch to a separate search index. Instead, because detection rules run as scheduled SQL/Python jobs directly on these Unity Catalog tables, an analyst can investigate an anomaly, see exactly which SQL clause caused a false positive, and instantly tune and validate the rule against historical data within the same query editor.
Sample Detection Rule: Attempted Login from a Denied IP
As shown in the sample rule above, the logic flows line-by-line like a normal data pipeline, allowing analysts to inspect raw logic, tweak filtering clauses instantly, and aggregate attacker metrics, validating them within the query editor.
Another crucial architectural point: Lakewatch is strictly serverless. Unity Catalog holds the metadata, the events live as Delta files in cloud storage, and SQL Warehouses handle compute. Moreover, it's not required to spin up a cluster before you can investigate and scheduled rules aren't queued behind your ad-hoc query.
Productivity through hands-on training
Transitioning from a traditional index-based SIEM to a Databricks lakehouse architecture requires a mental shift for SOC analysts. To bridge these skill gaps, Rearc developed a hands-on Lakewatch training program. Lakewatch training at Rearc, covers five modules, and every module follows the same shape: a short conceptual briefing, a live demo, and then a hands-on lab. The labs are capture-the-flag style. You find the activity, write the query, and make the detection fire, with hints and checkpoints if you need them. Synthetic data is staged ahead of time, so every lab behaves identically for everyone, and nobody burns twenty minutes on an environment problem while the rest of the room moves on.
Key learnings
#1: Speaking Spark SQL Instead of Splunk SPL
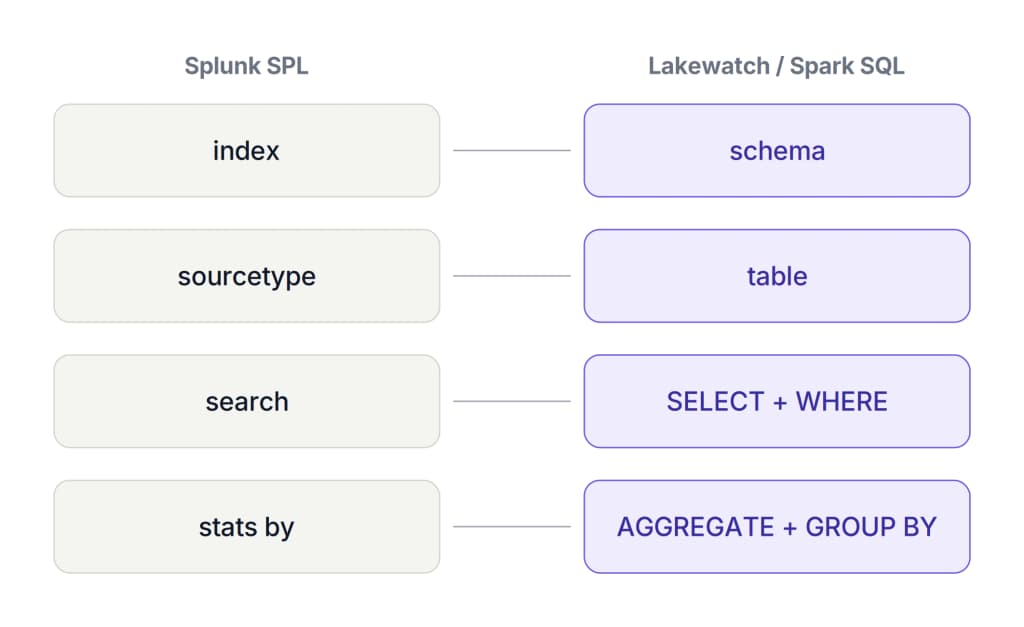
For a Splunk user, the Lakewatch terminology and syntax may appear unfamiliar at first look. However the terms map directly: a Splunk index correlates to a Databricks Lakehouse schema, a sourcetype correlates to a table, and foundational search commands such as stats by translates to AGGREGATE + GROUP BY.
The primary shift would be to acknowledge that Lakewatch utilizes a structured, relational model governed by Unity Catalog. Security logs are parsed and normalized upon ingestion and stored in strictly defined Delta tables. Consequently, analysts must transition their investigative mindset from executing open-ended keyword searches across indexes to explicitly querying fully qualified relational paths (e.g., catalog.schema.table).
#2: Platform Navigation
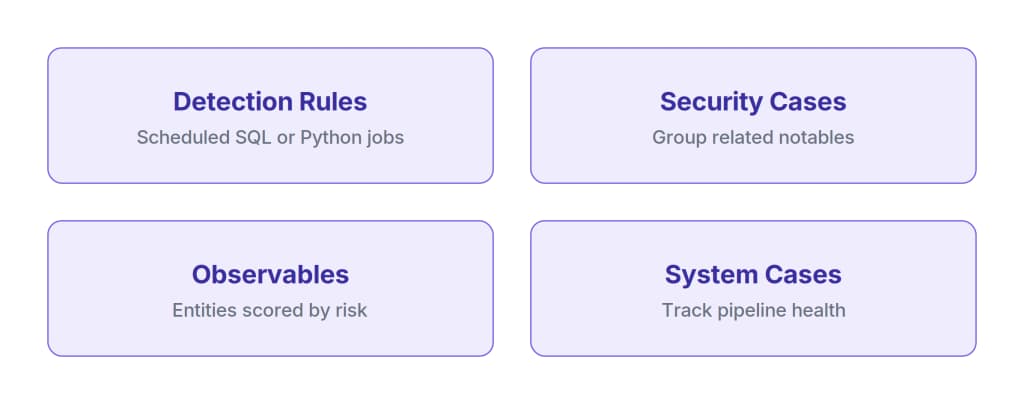
Treating pipeline health as a detection problem rather than an ops problem was an important learning. After all, the most dangerous alert is the one that never fires because the pipeline failed. To address this, detection rules, security cases, observables, and system cases act as the operational drivers. System cases specifically surface this class of failure, ensuring a broken ingestion pipeline becomes something you triage early.
#3: Bringing Data In
Underneath Lakewatch, data ingestion is driven by presets. A preset is a declarative configuration template that defines how raw vendor telemetry moves through your data pipeline. Instead of writing custom, ad-hoc ETL scripts for every new log source, a preset serves as a reusable blueprint in the form of a YAML file that automates data ingestion, parsing, and schema normalization.
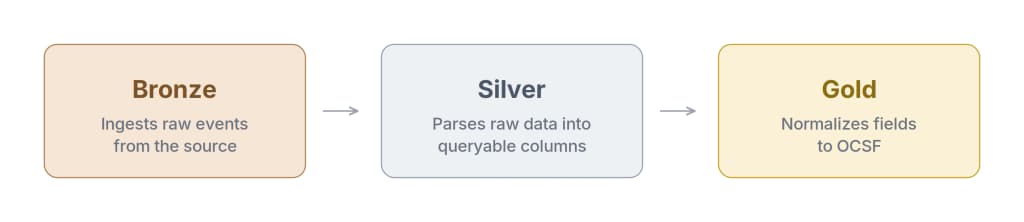
These presets dictate how data flows through Lakewatch's medallion architecture—a structured, multi-layer pipeline within the Databricks Lakehouse. Acting as translation guides, the presets map raw vendor logs into standard columns across three distinct stages:
Bronze: Ingests the raw data directly from the source.
Silver: Parses the raw data into queryable columns.
Gold: Normalizes the extracted fields to OCSF (the Open Cybersecurity Schema Framework).
Sample Preset: Microsoft Defender Logs
//YAML preset configuring the Medallion architecture flow for Microsoft Defender logs
name: microsoft_defender_conceptual_preset
description: "How the Medallion architecture flows in a Lakewatch preset"

bronze:
  loadAsSingleVariant: True
  preTransform:
    - [ "explode(data:records::array<variant>) as _raw" ]

silver:
  transform:
    - name: ms_defender_parsed_events
      fields:
        - name: event_time
          expr: _raw:properties.Timestamp::timestamp
        - name: action_type
          expr: _raw:properties.ActionType::string
        - name: vendor_protocol
          expr: _raw:properties.Protocol::string

gold:
  - name: authentication
    input: ms_defender_parsed_events
    fields:
      - name: class_name
        literal: 'Authentication'
      - name: auth_protocol_id
        expr: |
          CASE
            WHEN lower(vendor_protocol) = 'ntlm' THEN CAST(1 AS INT)
            WHEN lower(vendor_protocol) = 'kerberos' THEN CAST(2 AS INT)
            ELSE CAST(0 AS INT)
          END
This preset acts as a translation guide moving raw Microsoft Defender logs through the three layers of the medallion pipeline. Bronze simply ingests the raw JSON payload into a flexible VARIANT column (holds raw JSON, flexibly without a strict schema). Silver parses specific fields out of that JSON into queryable columns. Finally, Gold normalizes those extracted fields into standard OCSF integer IDs, ensuring your detection rules can evaluate the data regardless of the original log source.
This Gold layer normalization is exactly how you prevent the "Unknown status" mapping failure mentioned at the beginning of this post. By using explicit CASE statements within your YAML preset (as seen in the sample above), you strictly define raw vendor quirks like sending status=denied instead of status=failure map directly to standard OCSF formats. This ensures no unmapped values silently fall through to an "Unknown" state, keeping your detection rules accurate.
Building these presets is the core skill of the platform. The hard-won lesson here is to always validate your expressions against the raw VARIANT structure.
#4: Detection Engineering
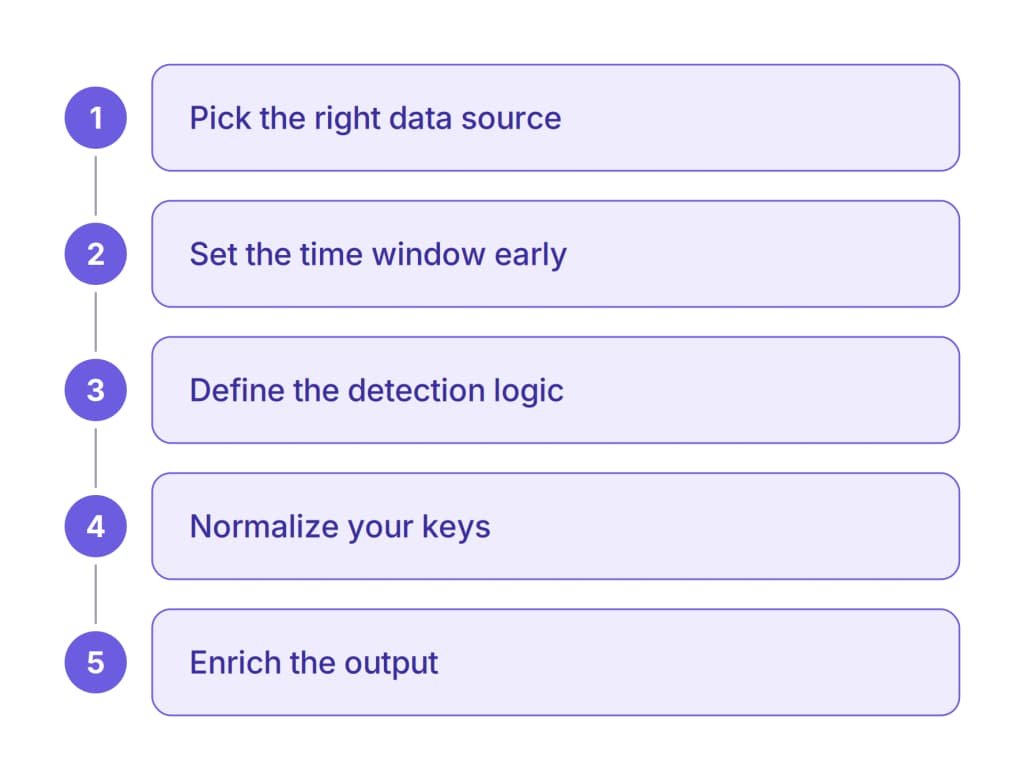
When building a detection, the process usually breaks down into five steps:
Picking the right data source.
Setting a time window early on.
Defining the actual logic.
Normalizing your keys.
Enriching the output.
The resulting notable (the discrete piece of evidence mentioned earlier) gives you the exact time frames and pivot keys you need to actually investigate. From there, your focus shifts to the bigger picture. Because the system groups related notables together, you can quickly see if this single detection is part of a larger attack chain within a unified Security Case. If it is just noise, you take those learnings, tune the original logic, and tighten up the rule.
#5: Genie and Dashboards — A First-Draft Tool
Genie takes a plain-English question and returns SQL that you can read before you run it. It gets you to a working query quickly, but treat the output as a first draft: read the generated SQL closely, check the join keys and the time bounds, then run it. Used that way, it's genuinely fast, especially for the questions you'd otherwise put off. The idea is that writing the query can be hard, and it's helpful to have a tool to get to the first draft.
Dashboards split along the same line as investigation. Charts are for triage: spotting the spike, the outlier, the host that doesn't look like its neighbors. Tables are for the detail once you know where to look: specific events behind the spike. Also, set your dashboard refresh rates based on the audience. A live SOC screen needs to update every few minutes, but a daily summary is usually fine for leadership. There is no reason to pay for an hourly compute over the weekend if no one is going to check the data until Monday.
Who should take this training
Teams already on or moving to the Databricks Lakehouse
SOCs that want transparent, refinable detections rather than black-box rules
SOCs that will benefit from detection, investigation, and reporting to run on the same data
Teams creating cross-vendor detections against normalized OCSF events
Worth weighing carefully before choosing Lakewatch
Teams with no Databricks footprint and no appetite to build one
Shops deeply invested in a mature existing SIEM with no migration pressure
What I'd tell someone starting out with Lakewatch
Come in with one source you already know. Every concept lands faster when you can map it onto data whose quirks you already argue with.
Before you trust a table, group by its enum columns. The same value on every row usually means something upstream is wrong.
When a query returns nothing, assume you're wrong before you assume the data is quiet. That instinct is the one that carries past the training.
Conclusion
A platform shift shouldn't open a security gap, and that's the gap this training is built to close. After two days of training, I became confident with the workflows inside Lakewatch, from writing detections to running investigations.
At Rearc, our Cyber Solutions team does this work day to day. We deliver this training, build and validate the source mappings that feed it, and stand up the detection coverage that runs on the Lakewatch platform. If you're planning a Databricks Lakehouse SIEM migration or want a SOC upgrade, we'd love to have a conversation.
Latest Articles
Read more about the latest and greatest work Rearc has been up to.